Making Graphs with Neo4j

Graphs, Graphs, Everywhere
On occassion in our field we come across complexities and masses of data. When things start to blur and become hard to read or when you are overcome by the mass amount of unstructured data. Sometimes it helps to turn to graphs, to simplfy things, or establish patterns that you can then lock into for further analysis.
Getting started with graphs, can initially be tricky, but this can be made easier by learning neo4j and cypher query language.
Neo4j
Neo4j is a highly scalable native graph database, purpose-built to leverage not only data but also data relationships.
Using Neo4j, developers build intelligent applications that traverse today’s large, interconnected datasets in real time. Powered by a native graph storage and processing engine, Neo4j delivers an intuitive, flexible and secure database for unique, actionable insights. - Neo4j.com
Docker & Neo4j
Rather than fight the dependancies of Node, its mucheasier to fire up a pre-bulit image in Docker:
docker pull neo4j
When firing up neo4j in docker, you will need to expose the following ports, and optionally set up credentials.
docker run -p7474:7474 -p7687:7687 -e NEO4J_AUTH=neo4j/s3cr3t neo4j
The NEO4J_AUTH can be ommitted, and you can set up user accounts on the TCP/7474 management interface.
Cypher Query Language
The Cypher query lanuage can inititally be intimidating, but this reference card is very useful
Example Model - Products
In Neo4J we can import data from a csv file (the csv can even be from an internet hosted file) and make objects and relationships. In this simple example we map the following nodes and relationship
- product p
- supplier s
- relationship p -> has supplier -> s
LOAD CSV WITH HEADERS FROM 'http://data.neo4j.com/northwind/products.csv' AS row
MERGE (p:Product {productId:row.productID,unitPrice:row.unitPrice,unitsInStock:row.unitsInStock,productName:row.productName})
MERGE (s:Supplier {supplierID: row.supplierID})
MERGE (p)-[r:HAS_SUPPLIER]->(s);
Now we can run cypher queries against our model and visualise results in a graph or optionally a table.
Return all nodes
MATCH(n) RETURN *
Delete all nodes
MATCH (n) DELETE n;
Return all products
MATCH (p:Product) RETURN *
Wildcard search for beer
MATCH (p:Product) where p.productName =~ '.*(Ale|Stout|Beer|Larger)' RETURN p;
Convert a text field to float (or Int with toInteger)
MATCH (p:Product) SET p.unitPrice = toFloat(p.unitPrice);
Numerical search
MATCH (p:Product) where 10 <= p.unitPrice <= 20 RETURN *;
Neo4J and MITRE ATT&CK
A handy project is https://github.com/vmapps/attack2neo which uses the json data file from Mitre Enterprise Attack.json. It will construct the nodes and relationships for you to built cipher queries against specific threat actor groups, or reverse TTPs from techniques and software to identify possible attack groups.
However, we(at Netscylla) found a few querks, like software and tools were two different objects, so we modified the code to make the structure easier and simpler to navigate. We even included a sample version of enterprise_attack.json, but youmay want to grab a fresh update. Our changes can be found here:
An example of looking at Lazarus Group
Query
Match (g:Group) where g.name = "Lazarus Group" return *
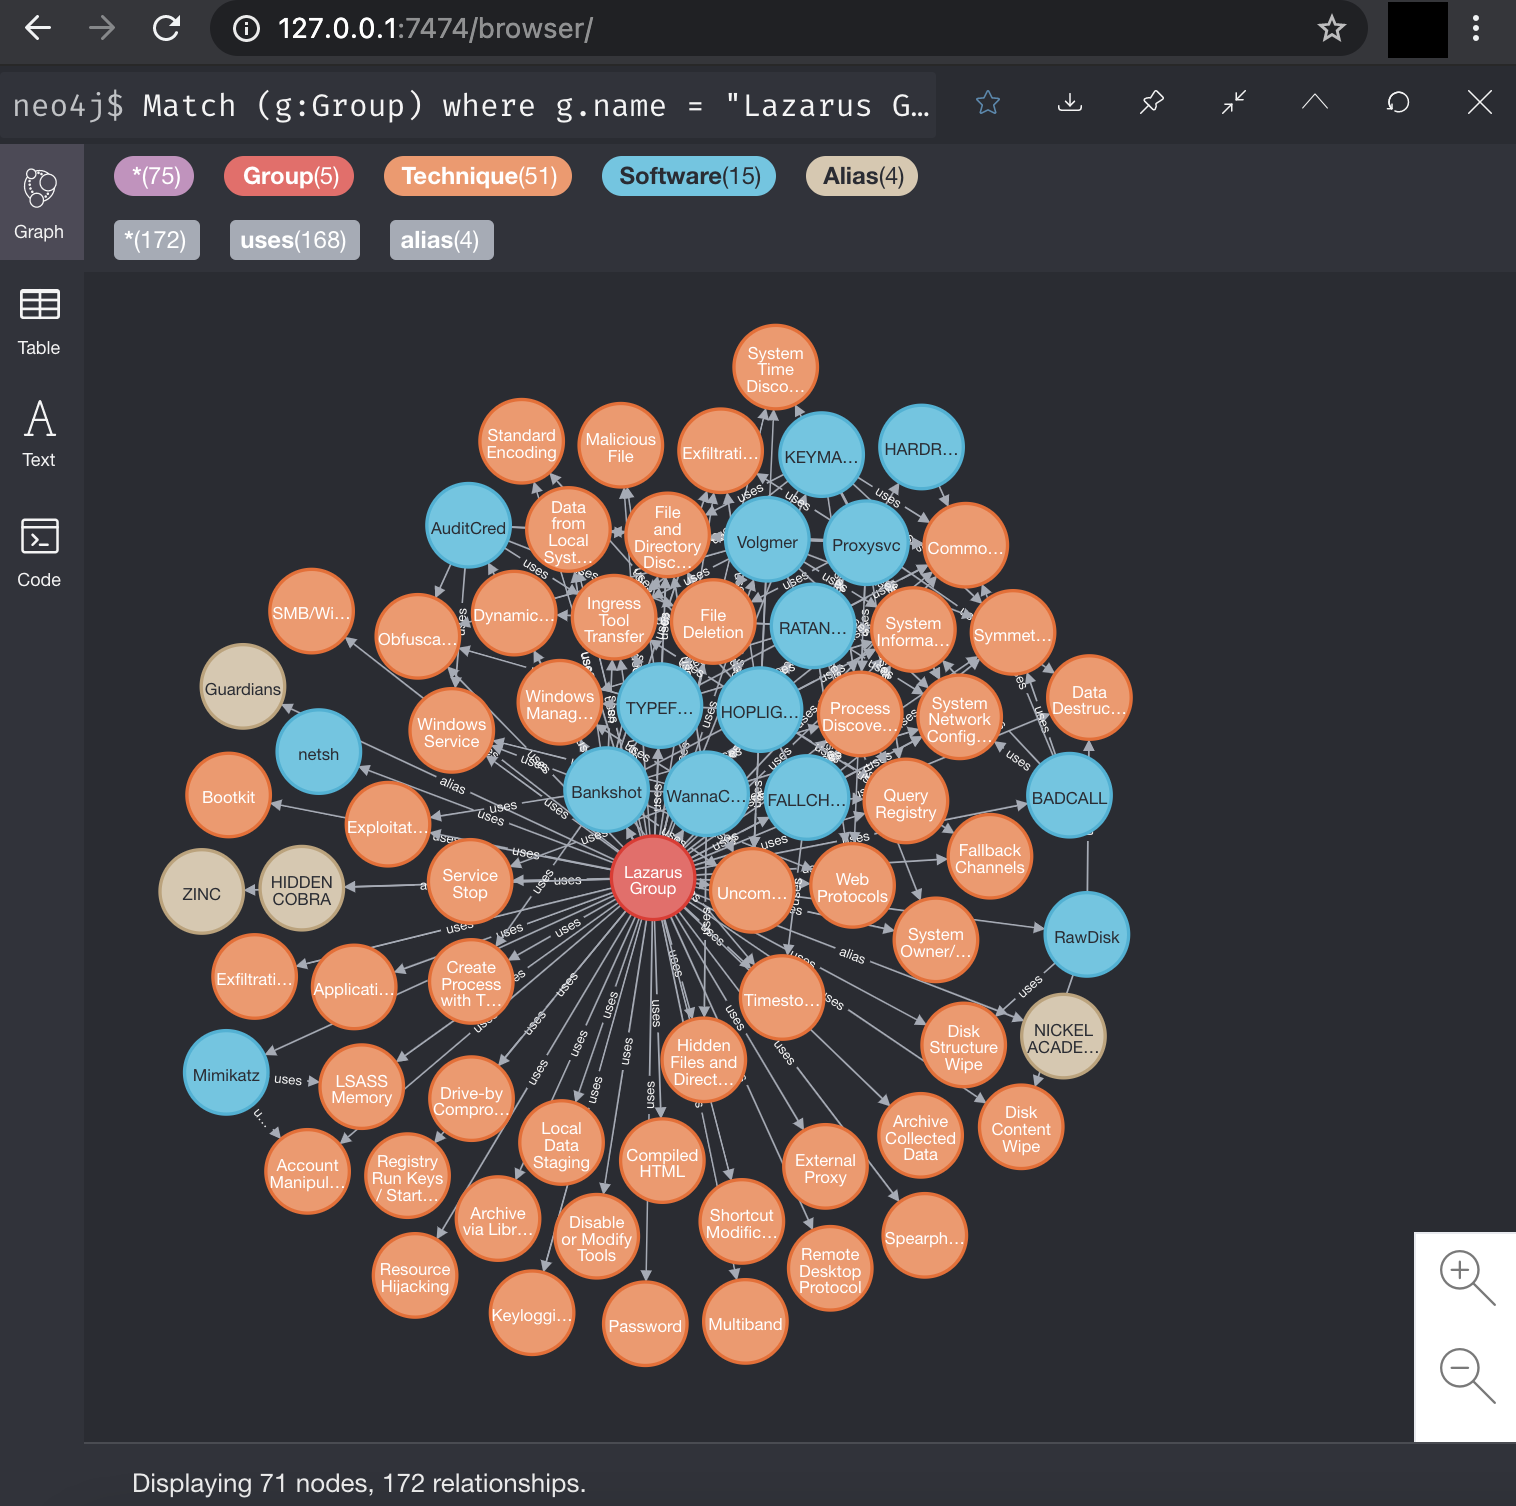
The original project and Readme file have a few more examples, so please read the documentation, and have fun building queries!
Neo4J and Netflow / Packet Analysis
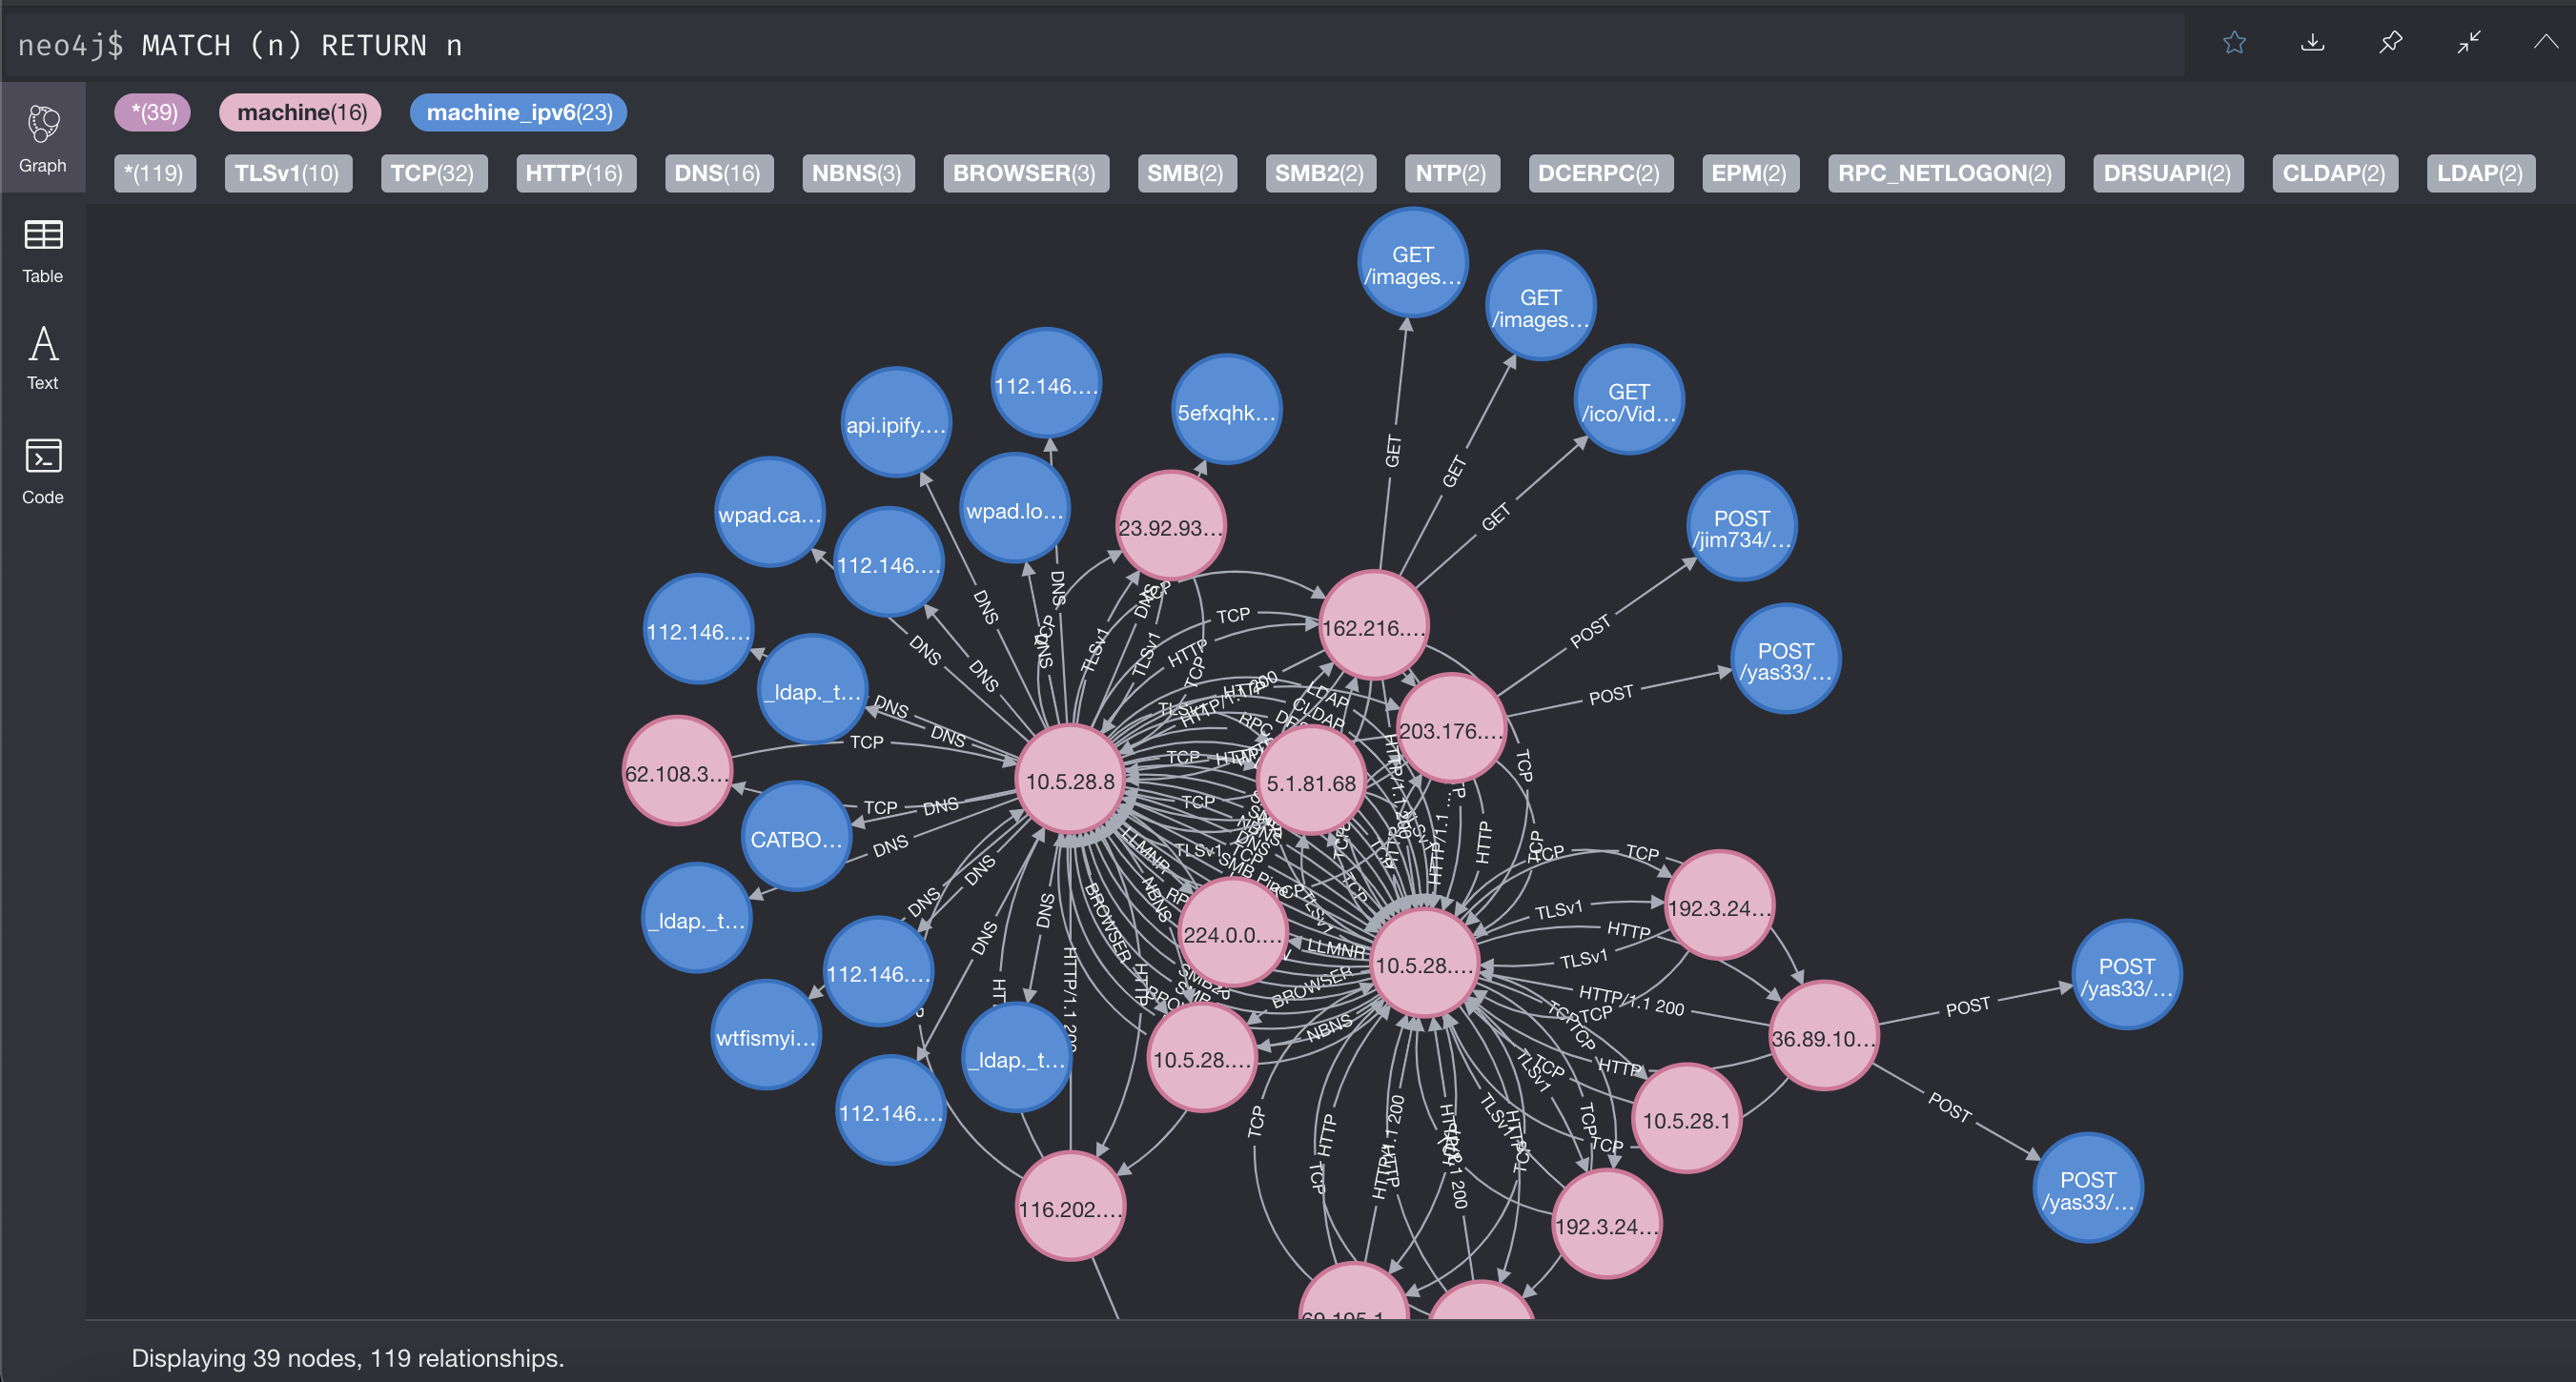
Some times when analysing PCAP captures of network traffic for suspicious activity or malware? Finding that needle in the haystack can be tricky. Visualising the Netflows can make pin-pointing the suspicious or malware related activity easier. A starter project is https://github.com/michoo/pci aka Packet Communicator Investigator.
Again at Netscylla, we slightly modifiede the base code to pull out HTTP requests and DNS data into nodes and additional relationships, so suit our own needs and goals. Our modifications can be found here:
An example looking at malware Netflows
The sample was downloaded from https://www.malware-traffic-analysis.net/2020/05/28/index.html
Conclusion
Remeber to read all the code, our examples typically use testing credentials neo4j:test so rememeber to change these to more secure alternatives and to match your neo4j installation.
From our examples you can see the graphing and Neo4j can be a powerful tool in the incident responders toolkit. It can be handy in incident response and network forensic tasks. From graphing attacks, to graphing attackers and their TTPs.
Have fun making your own graphs!
References
- https://neo4j.com/
- https://neo4j.com/developer/docker/
- https://neo4j.com/docs/cypher-refcard/current/
- https://www.malware-traffic-analysis.net/2020/05/28/index.html
Share on: