Kibana, Wazuh and Bro IDS
![]()
![]()
![]()
Recently we have been helping SME’s increase their cyber detection capabilities, with some Open Source and freely available tools. In this post we briefly discuss Wazuh and Kibana dashboards using the ELK stack (Elastic Search, Logstash, Kibana) before walking through an installation of Bro IDS, and Critical-stacks free threat intelligence feeds!
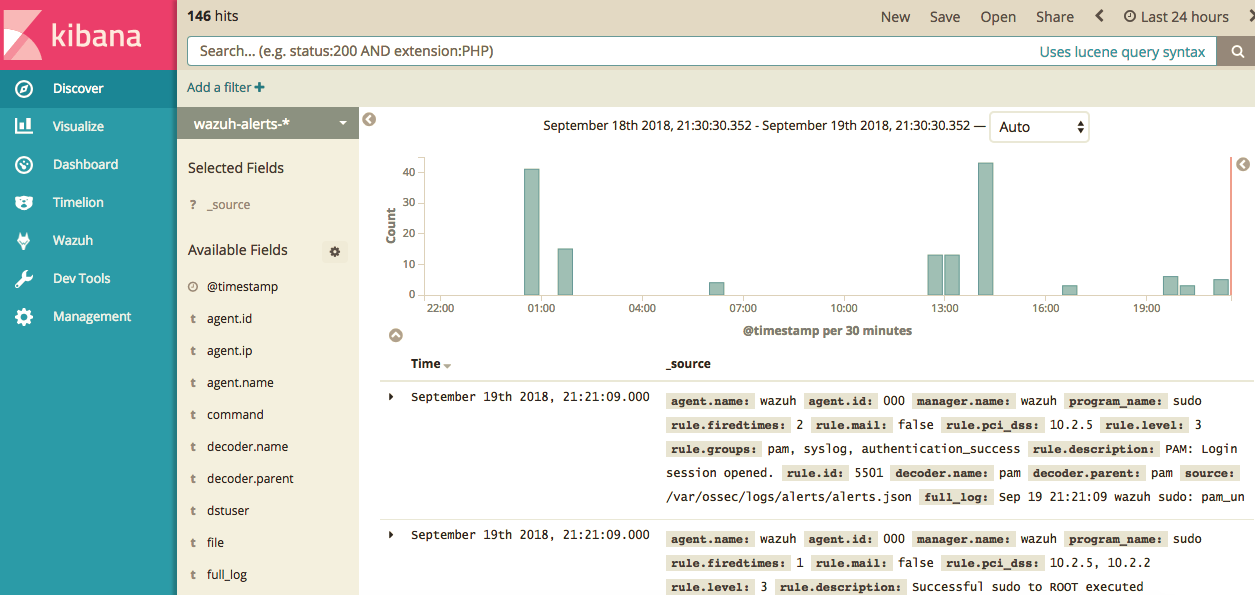
What is Wazuh
Wazuh is a next-generation version of OSSEC a Host-based Intrusion Detection System (HIDS). It is already pre-configured with a number of transforms, queries and visualisations that can help you detect host based intrusions, monitor your compliance with CIS and other compliance programs such as PCI DSS and GDPR through additional plugins.
Installing ELK & Wazuh
We followed the instructions from Wazuh here
The instructions are quite detailed and lengthy - but most importantly accurate! So we don’t feel like we have the need to repeat those same instructions here.
Once successfully installed you should be able to access Kibana and Wazuh at http://your_server:5601
So with our HIDS sucessfully installed, lets move onto the next step installing our NIDS!
Installing Bro
BRO is an Open Source IDS project. Its relatively easy to install. But can be slightly complicated to setup with Kibana. We have tried several walkthoughs on the Internet with no success. So we decided to create our own installation and walkthrough so that others can easily follow and repeat our instructions to get up and running with minimal fuss!
Ubuntu install
Git is already installed by default on Ubuntu, so you can clone the repository with the following command. The files will be put into a directory named bro.
git clone --recursive git://git.bro.org/bro
Change into the project’s directory.
cd bro
Run Bro’s configuration, which should take less than a minute.
./configure
make
You’ll see a percentage completion at the beginning of most lines of output as it runs.
Once it finishes, install Bro, which should take less than a minute.
sudo make install
Bro will be installed in the /usr/local/bro directory.
Now you need to add the /usr/local/bro/bin directory into your $PATH. To make sure it’s available globally, the best approach to accomplish that is to specify the path in a file under the /etc/profile.d directory. We’ll call that file 3rd-party.sh.
export PATH=$PATH:/usr/local/bro/bin
Now that Bro is installed, we need to make some configuration changes for it to run properly.
Step 4 — Configuring Bro
In this step, we’ll customize a few files to make sure Bro works properly. All the files are located in the /usr/local/bro/etc directory, and they are:
- node.cfg, which is used to configure which nodes to monitor.
- networks.cfg, which contains a list of networks in CIDR notation that are local to the node.
- broctl.cfg, which is the global BroControl configuration file for mail, logging, and other settings.
Let’s look at what needs to be modified in each file.
Configuring Which Nodes to Monitor
To configure the nodes Bro will monitor, we need to modify the node.cfg file.
Out of the box, Bro is configured to operate in standalone mode. Because this is a standalone installation, you shouldn’t need to modify this file, but it’s good to check that the values are correct.
Open the file for editing.
sudo nano /usr/local/bro/etc/node.cfg
Under the bro section, look for the interface parameter. It’s eth0 by default, and this should match the public interface of your Ubuntu 16.04 server. If it’s not, make sure to update it.
/usr/local/bro/etc/node.cfg
[bro]
type=standalone
host=localhost
interface=eth0
Save and close the file when you’re finished. We’ll configure the private network(s) that the node belongs to next.
Configuring the Node’s Private Networks
The networks.cfg file is where you configure which IP networks the node belongs to (i.e. the IP network of any of your server’s interfaces that you wish to monitor).
To start, open the file.
sudo nano /usr/local/bro/etc/networks.cfg By default, the file comes with the three private IP blocks already configured as an example of how yours need to be specified.
/usr/local/bro/etc/networks.cfg
# List of local networks in CIDR notation, optionally followed by a
# descriptive tag.
# For example, "10.0.0.0/8" or "fe80::/64" are valid prefixes.

10.0.0.0/8          Private IP space
172.16.0.0/12       Private IP space
192.168.0.0/16      Private IP space
Delete the existing three entries, then add your own. You can use ip addr show to check the network addresses for your server interfaces. The final version of your networks.cfg should look similar to the following, with your network addresses substituted in:
Example /usr/local/bro/etc/networks.cfg
192.168.1.0/24          Public IP space
172.16.100.0/24         Private IP space
Save and close the file when you’re finished editing it. We’ll configure mail and logging settings next.
Step 5 — Managing Bro with BroControl
BroControl is used for managing Bro installations — starting and stopping the service, deploying Bro, and performing other management tasks. It is both a command line tool and an interactive shell.
If broctl is invoked with sudo /usr/local/bro/bin/broctl, it will launch the interactive shell:
Welcome to BroControl 1.5-21

Type "help" for help.

[BroControl] >
You can exit the interactive shell with the exit command.
From the shell, you can run any valid Bro command. The same commands can also be run directly from the command line without invoking the shell. Running the commands at the command line is often a more useful approach because it allows you to pipe the output of a broctl command into a standard Linux command. For the rest of this step, we’ll be invoking broctl commands at the command line.
First, use broctl deploy to start Bro and ensure that files needed by BroControl and Bro are brought up-to-date based on the configurations in Step 4.
sudo /usr/local/bro/bin/broctl deploy
Converting Bro logs to JSON
By default Bro logs are TSV’s (Tabbed Separator Values)! However, ElasticSearch operates more efficiently with JSON files.
No problem, we simply modify /usr/share/bro/share/site/bro.local to include the following at the bottom of the file
@load tuning/json-logs
redef LogAscii::json_timestamps = JSON::TS_ISO8601;
redef LogAscii::use_json = T;
Now restart bro, and all our log files should be in a JSON format ready for ingestion.
sudo /usr/local/bro/bin/broctl restart
Filebeat
First we move our original wazuh filebeat configuration to a new direcotry conf.d.
Simply copy the instructions below:
cd /etc/filebeat
mkdir conf.d
mv filebeat.yml conf.d/
cat << EOF > filebeat.yml
filebeat:
  config_dir: /etc/filebeat/conf.d
output:
 logstash:
   # The Logstash hosts
   hosts: ["127.0.0.1:5000"]
EOF
then create our bro filebeat configuration in /etc/filebeat/conf.d/filebeat_bro.yml
filebeat:
 prospectors:
  - input_type: log
    paths:
     - "/usr/local/bro/spool/bro/conn.log"
     - "/usr/local/bro/spool/bro/dns.log"
     - "/usr/local/bro/spool/bro/http.log"
     - "/usr/local/bro/spool/bro/intel.log"
    document_type: json
    json.message_key: log
    json.keys_under_root: true
    json.overwrite_keys: true

output:
 logstash:
   # The Logstash hosts
   hosts: ["127.0.0.1:5001"]
Logstash
Our Logstash configuration /etc/logstash/conf.d/bro.conf:
- https://gist.github.com/netscylla/54bcfec77e198cd402b5bd9a1ef75ee5
input {
    beats {
        port => 5001
        codec => "json"
#        ssl => true
#        ssl_certificate => "/etc/logstash/logstash.crt"
#        ssl_key => "/etc/logstash/logstash.key"
    }
}

filter {

  #Let's get rid of those header lines; they begin with a hash
  if [message] =~ /^#/ {
    drop { }
  }

    #Let's convert our timestamp into the 'ts' field, so we can use Kibana features natively
    date {
      match => [ "ts", "UNIX" ]
    }

    # add geoip attributes
    geoip {
      source => "id.orig_h"
      target => "orig_geoip"
    }
    geoip {
      source => "id.resp_h"
      target => "resp_geoip"
    }

    #The following makes use of the translate filter (logstash contrib) to convert conn_state into human text. Saves having to look up values for packet introspection
    translate {
      field => "conn_state"

      destination => "conn_state_full"

      dictionary => [
                    "S0", "Connection attempt seen, no reply",
                    "S1", "Connection established, not terminated",
                    "S2", "Connection established and close attempt by originator seen (but no reply from responder)",
                    "S3", "Connection established and close attempt by responder seen (but no reply from originator)",
                    "SF", "Normal SYN/FIN completion",
                    "REJ", "Connection attempt rejected",
                    "RSTO", "Connection established, originator aborted (sent a RST)",
                    "RSTR", "Established, responder aborted",
                    "RSTOS0", "Originator sent a SYN followed by a RST, we never saw a SYN-ACK from the responder",
                    "RSTRH", "Responder sent a SYN ACK followed by a RST, we never saw a SYN from the (purported) originator",
                    "SH", "Originator sent a SYN followed by a FIN, we never saw a SYN ACK from the responder (hence the connection was 'half' open)",
		                "SHR", "Responder sent a SYN ACK followed by a FIN, we never saw a SYN from the originator",
                    "OTH", "No SYN seen, just midstream traffic (a 'partial connection' that was not later closed)"
                    ]
    }

    mutate {
      convert => [ "id.orig_p", "integer" ]
      convert => [ "id.resp_p", "integer" ]
      convert => [ "orig_bytes", "integer" ]
      convert => [ "duration", "float" ]
      convert => [ "resp_bytes", "integer" ]
      convert => [ "missed_bytes", "integer" ]
      convert => [ "orig_pkts", "integer" ]
      convert => [ "orig_ip_bytes", "integer" ]
      convert => [ "resp_pkts", "integer" ]
      convert => [ "resp_ip_bytes", "integer" ]
      rename =>  [ "id.orig_h", "id_orig_host" ]
      rename =>  [ "id.orig_p", "id_orig_port" ]
      rename =>  [ "id.resp_h", "id_resp_host" ]
      rename =>  [ "id.resp_p", "id_resp_port" ]
    }
}

output {
  stdout { codec => rubydebug }
  elasticsearch {
        hosts => ["localhost:9200"]
        index => "bro-conn-%{+YYYY.MM.dd}"
        document_type => "bro"
        template => "/etc/logstash/bro.json"
        template_name => "bro"
        template_overwrite => true
  }
}
Our bro.json can be found here https://gist.github.com/netscylla/27ac9e1472d89dffa5a8267a6af9c9be
Final step
Restart logstash
systemctl restart logstash
and check your Kibana dashboard…
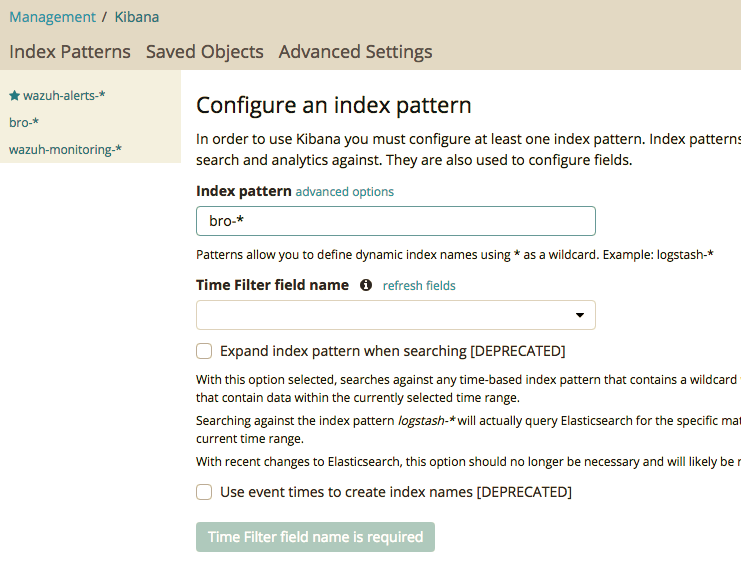
First you have to goto the managment panel, and click index patterns this will tell kibana about the location of your bro files like so:
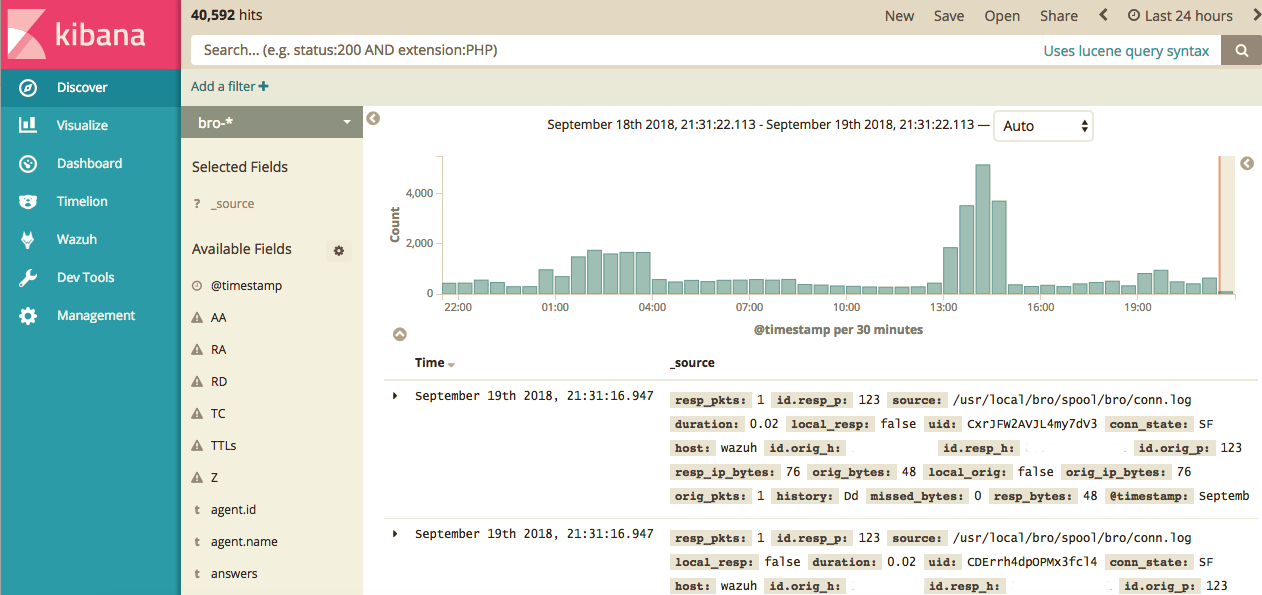
Then back to discover, and you should be seeing your bro logs!
Extra Step - Bro and Threat Intelligence
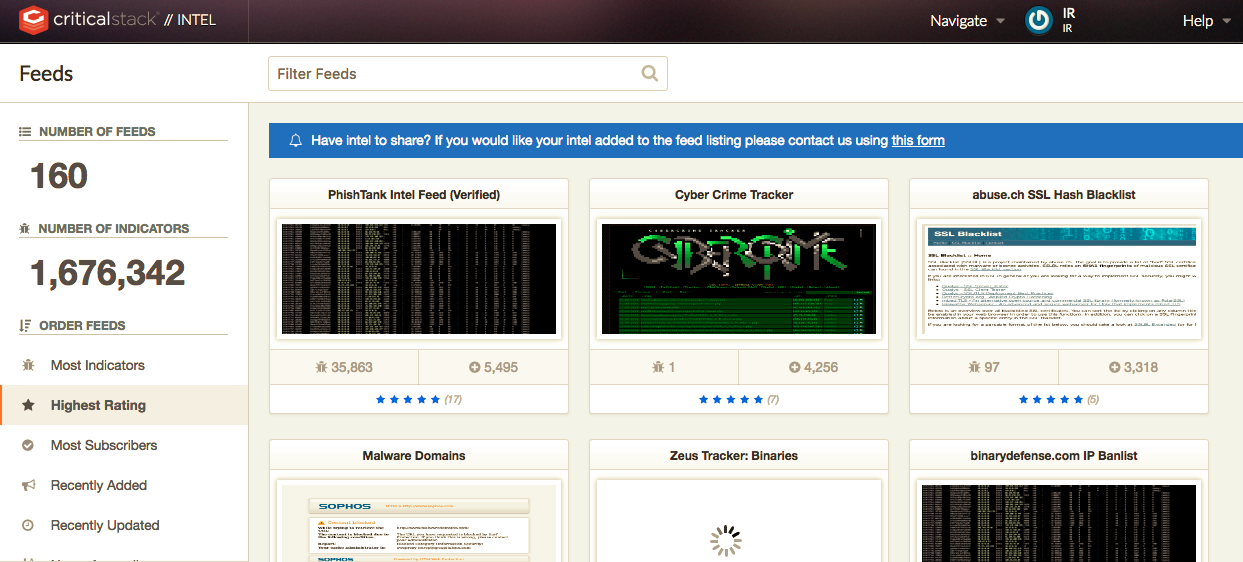
First sign up here for free threat intelligence feeds.
Choose your Container, feeds and sensor. (See screenshot of feeds below)
Eventually, you will see an api code, copy this to your clipboard, or notepad.
Follow the client install instructions for the critical-stack-intel binary:
Then connect the binary to the feed with the api code (internet access required), and it should pull down the subscribed threat intelligence feeds.
critical-stack-intel api [api_code_here]
And restart bro
sudo /usr/local/bro/bin/broctl restart
List your feeds with:
critical-stack-intel list
The End
We hope you have found this walkthrough informative and useful, and we hope you can follow these instructions with ease to create your own HIDS & NIDS monitoring system.
Share on: